Return to article.
|
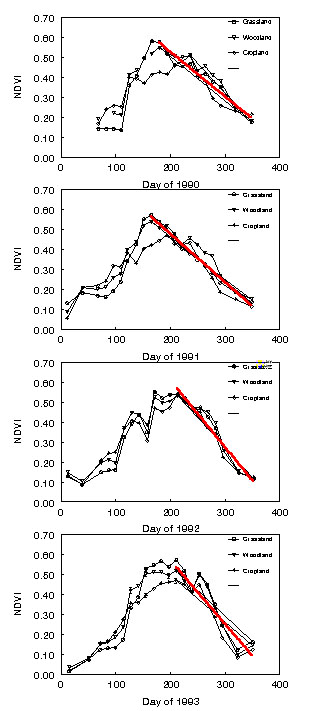
| Figure 4. NDVI as a function of day of year for (a) 1990, (b) 1991, (c)
1992 and (d) 1993 in grasslands, woodlands and croplands in the Flint Hills
of northeastern Kansas. The red line represents the rate of
senescence (decrease in NDVI / day) during the second half of the growing
season. Significant differences in the rate of senescence were 1992 >
1993 > 1991 = 1990. There were no significant differences in rate of
senescence due to cover type. Return to article. |