Return to article.
|
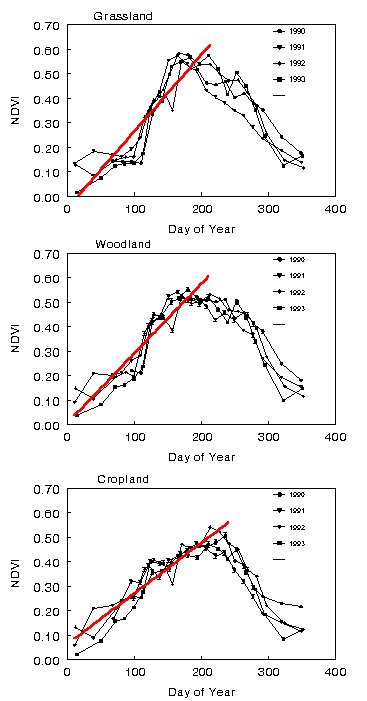
| Figure 3. NDVI as a function of day of year for (a) grasslands, (b) woodlands,
and (c) croplands in the Flint Hills of northeastern Kansas during 1990-1993.
The red line represents the rate of 'greenup' (increase in NDVI/day)
during the first part of the growing season. Rate of greenup was
significantly lower in cropland than in the other cover types. There were
no significant differences between years in rate of greenup. Return to article. |